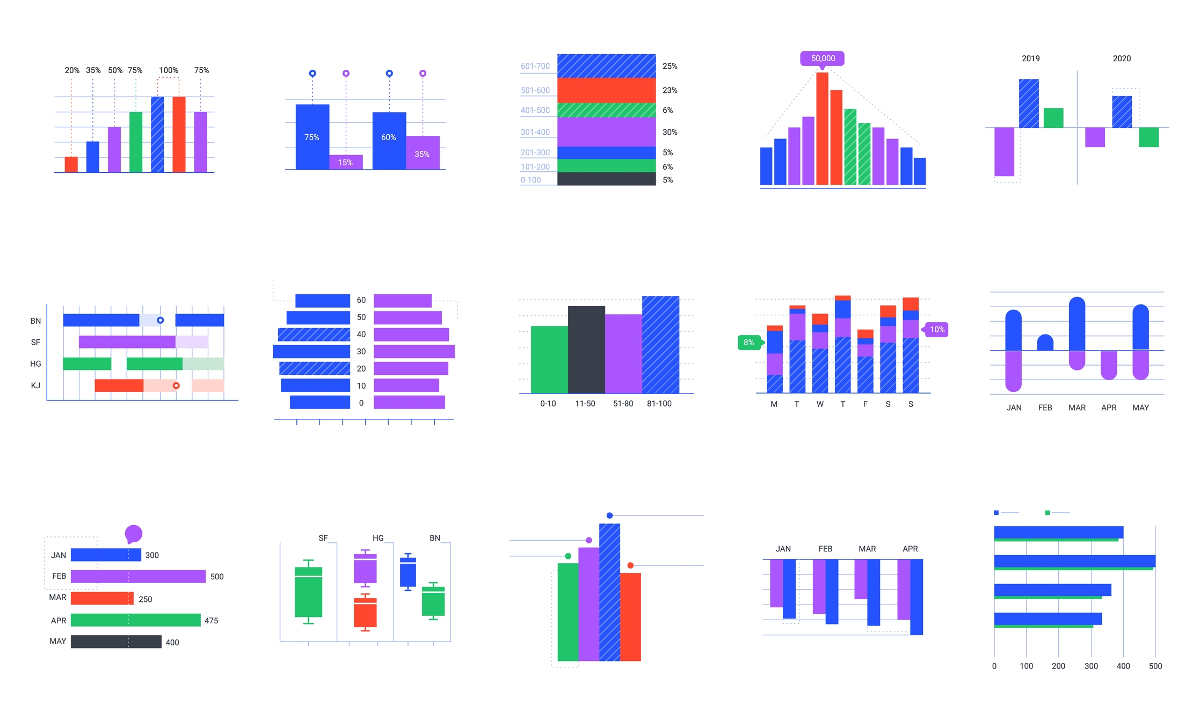

Data visualization is one of the essential parts of good business. You can't make the right decisions without a graphical representation of the vital data you have. Gathering as much information as possible has immense applications in both large corporations and smaller, local businesses.
When you've accumulated big data with a crawler, manual searching, or proxies, you will need to visualize it. One of the most common ways business owners and marketing managers choose to visualize their data is through the use of graphical elements, such as charts, listings, and graphs.
Visualizing your data is going to have quite an impact. When you present a piece of data in graphical form, you can guarantee that your peers, employees, or partners are going to understand it better.
But, choosing an improper color pallet might harm your whole presentation. That is why the color pallet matters so much in data visualization.